
The LAMBADA developmental mouse brain atlases have been added to BrainGlobe#
The structure of cerebral vasculature continues to develop after birth, but its spatiotemporal dynamics have always been unclear. To address this, de Launoit et al. (2026) created the light-sheet-aligned mouse brain annotated developmental atlas (LAMBADA) to align spatial transcriptomics data on key genes governing vascular development. Using seven different timepoints in development (P3, P5, P7, P9, P12, P14 and P21), the authors provide high resolution light-sheet fluorescence microscopy (LSFM) templates which are volume-corrected to in-vivo MRI benchmarks, ensuring that this developmental atlas reflects the natural brain growth trajectories as seen in development. We have packaged this atlas into BrainGlobe to make this resource usable throughout the BrainGlobe ecosystem.
The templates at each of the seven timepoints were made by averaging the autofluorescence of 20-30 iDISCO+ cleared C57bl6 mice of either sex, symmetrising them, then downsampling to 25µm resolution. They were then registered onto a separate in-vivo MRI template of three age-matched mouse brain samples per timepoint to create MRI transformation vectors to correct for morphological deformations. This allows for this developmental atlas to better represent the actual brain growth patterns of mice during development.
We have packaged the following atlases:
lambada_dev_mouse_p3_25umlambada_dev_mouse_p5_25umlambada_dev_mouse_p7_25umlambada_dev_mouse_p9_25umlambada_dev_mouse_p12_25umlambada_dev_mouse_p14_25umlambada_dev_mouse_p21_25um
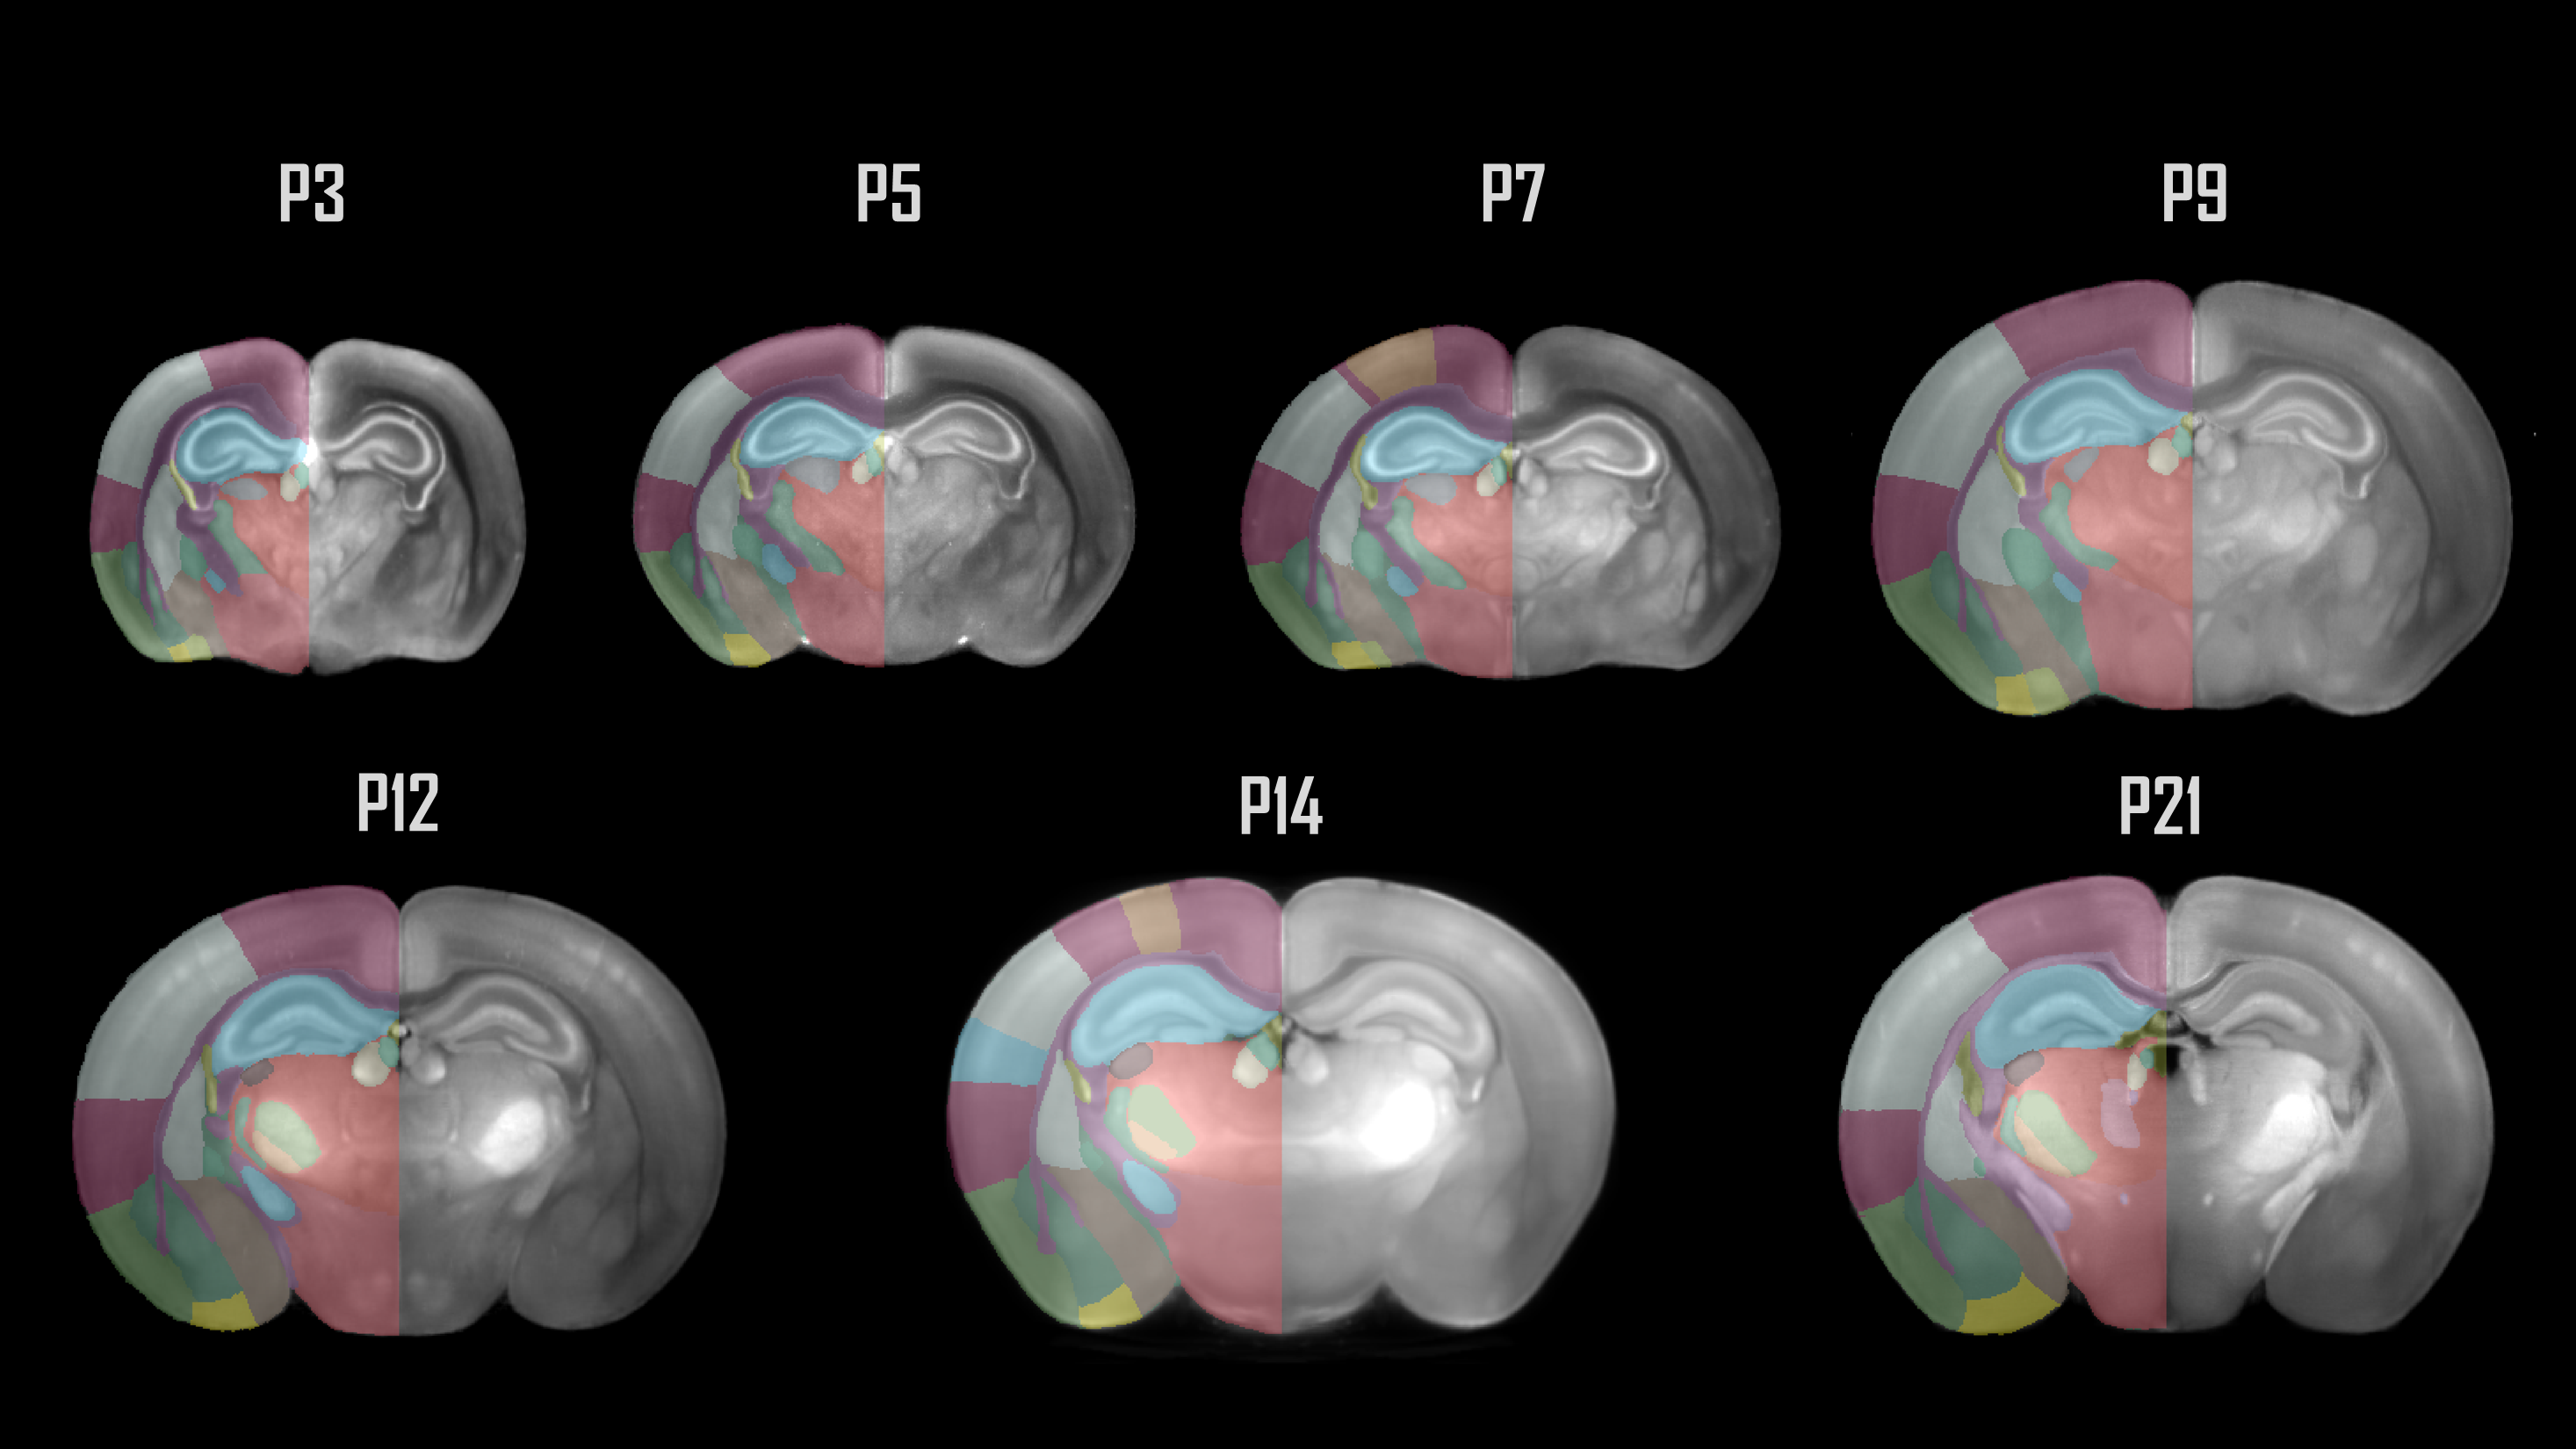
Figure 1. Coronal sections of the 7 developmental timepoints covered by LAMBADA.
How do I use the new atlases?#
You can use the LAMBADA developmental mouse brain atlases for analysis and visualisation like other BrainGlobe atlases. To visualise the atlases, you can either open them in Neuroglancer for viewing in the browser at:
or you can view them locally:
Install BrainGlobe (instructions)
Open napari and follow the steps in our download tutorial for the LAMBADA developmental mouse brain atlas
Visualise the different parts of the atlas as described in our visualisation tutorial
The end result will look something like Figure 2.
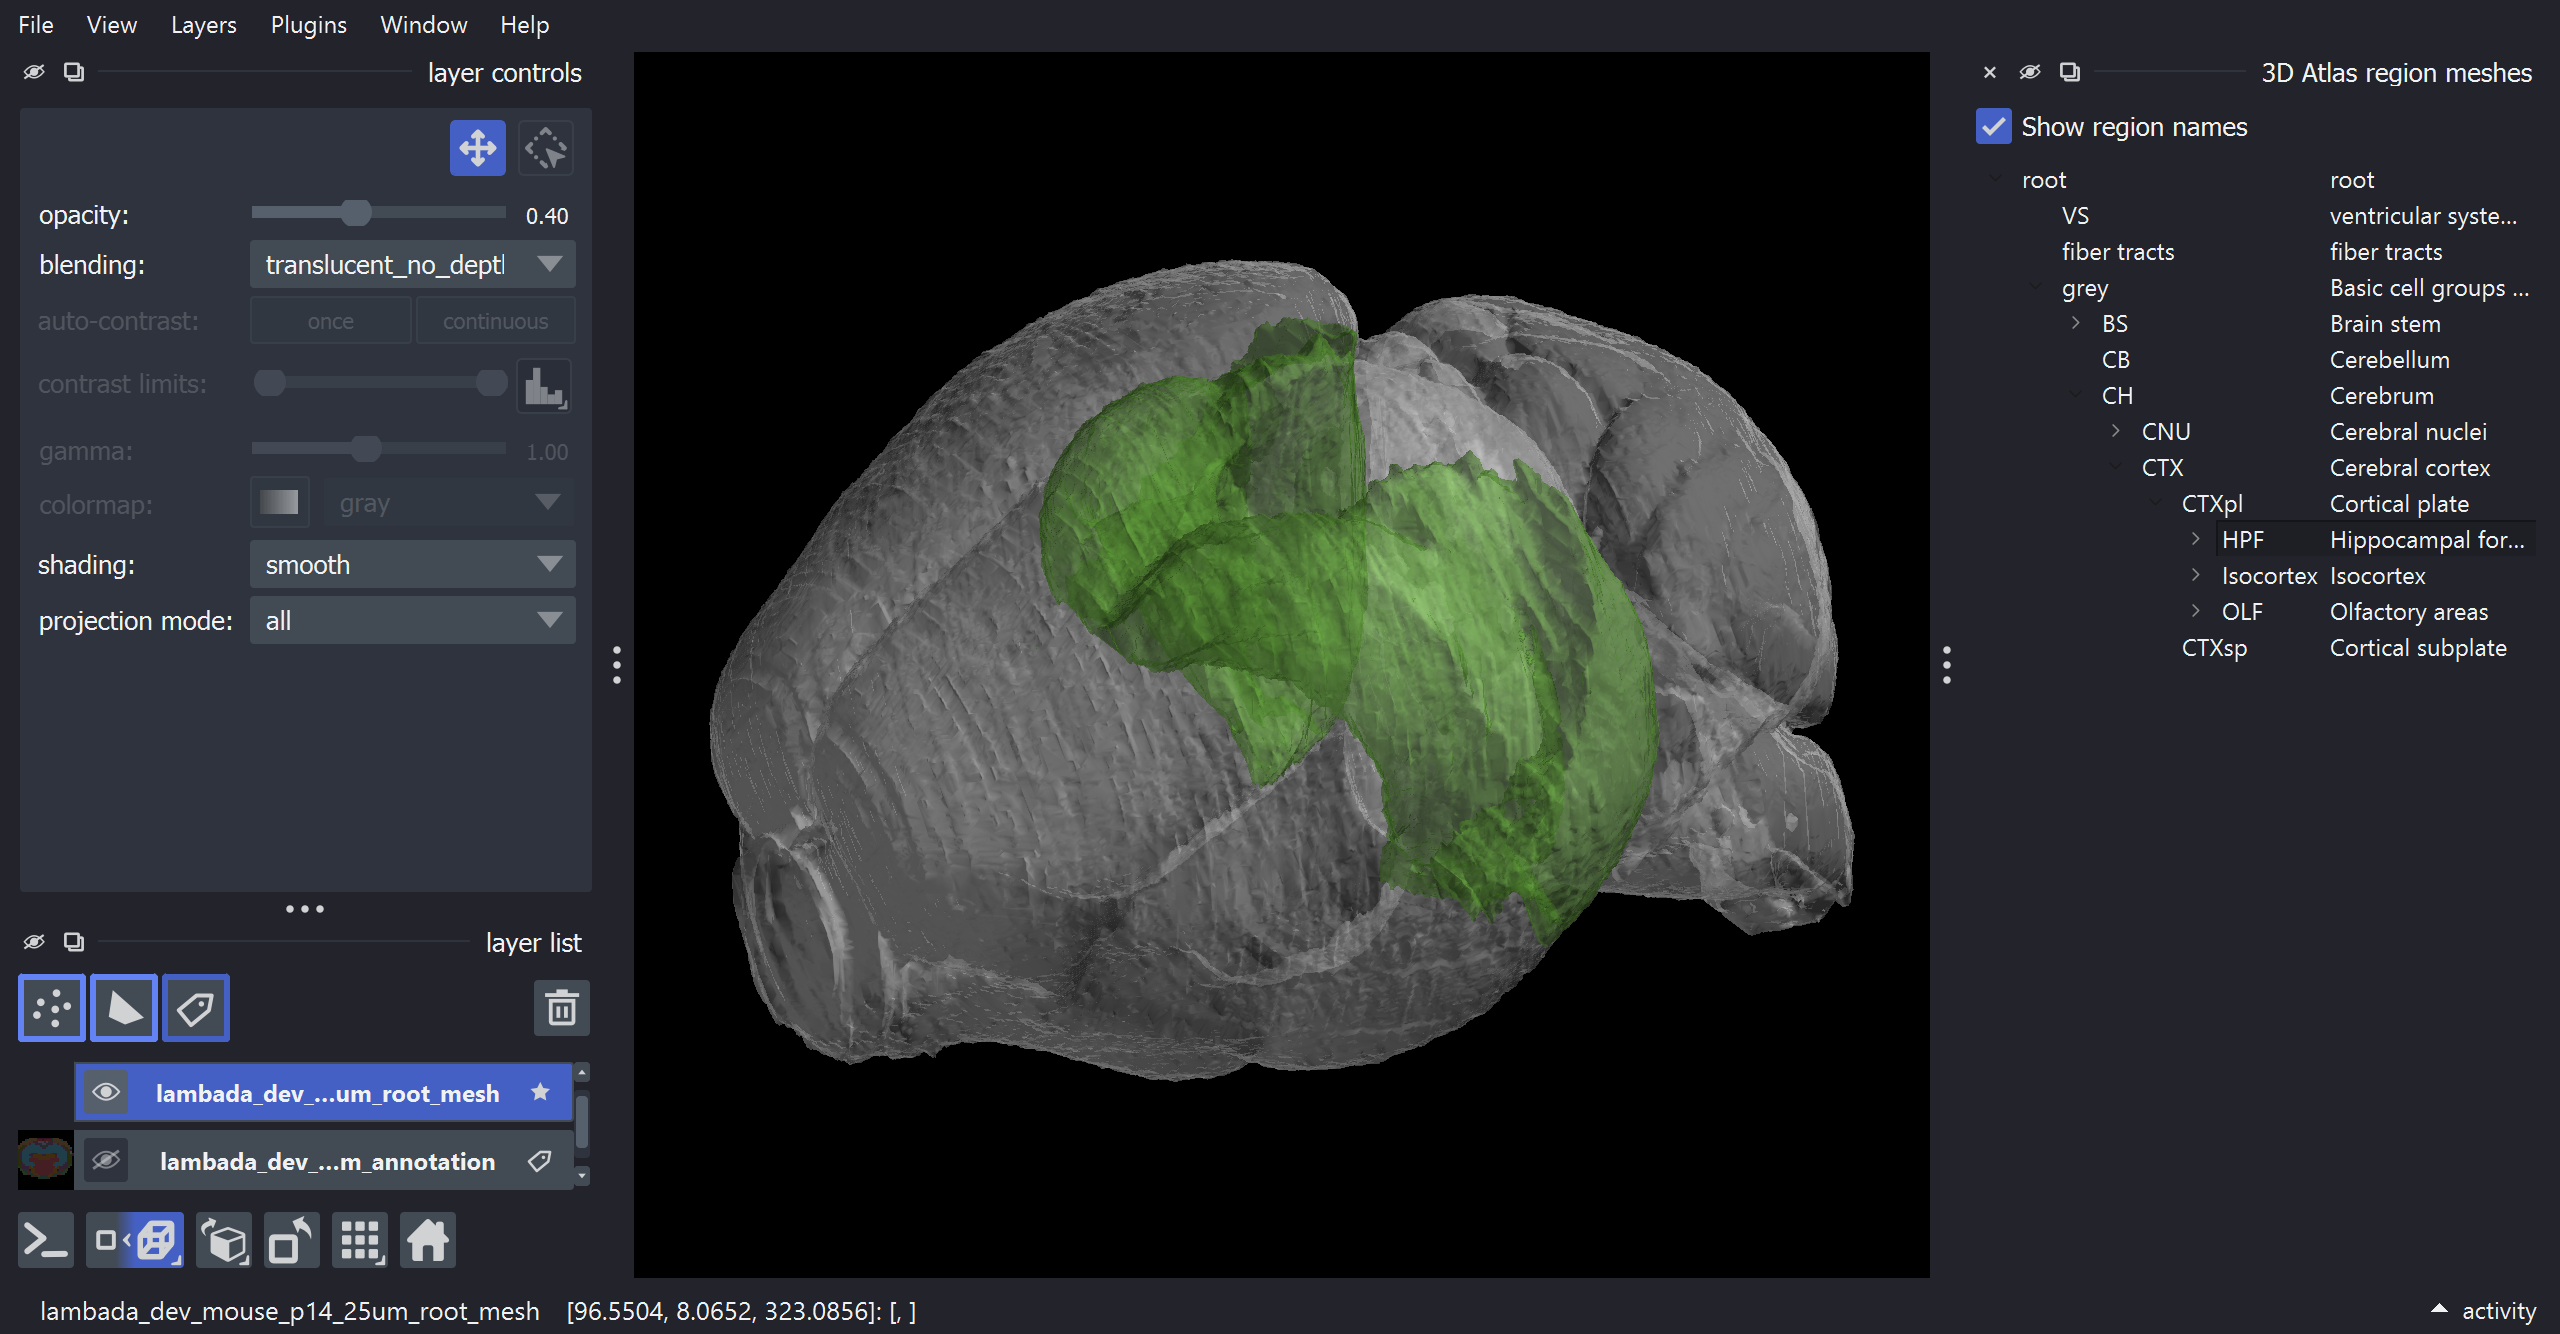
Figure 2: The P14 LAMBADA Developmental Mouse Brain atlas visualised with brainrender-napari: with mesh overlays for the brain (grey) and the hippocampal formation (green).
Why are we adding new atlases?#
A fundamental aim of the BrainGlobe project is to make various brain atlases easily accessible by users across the globe. If you would like to get involved with a similar project, please get in touch.