Visualising the results#
brainmapper comes with a plugin for napari for easily visualising the results.
For more information, see the visualisation section.
To quickly view your data:
Open napari (type
napariinto a command window).Into the window then drag and drop:
The signal channel directory (
test_brain/ch00),The entire brainmapper output directory.
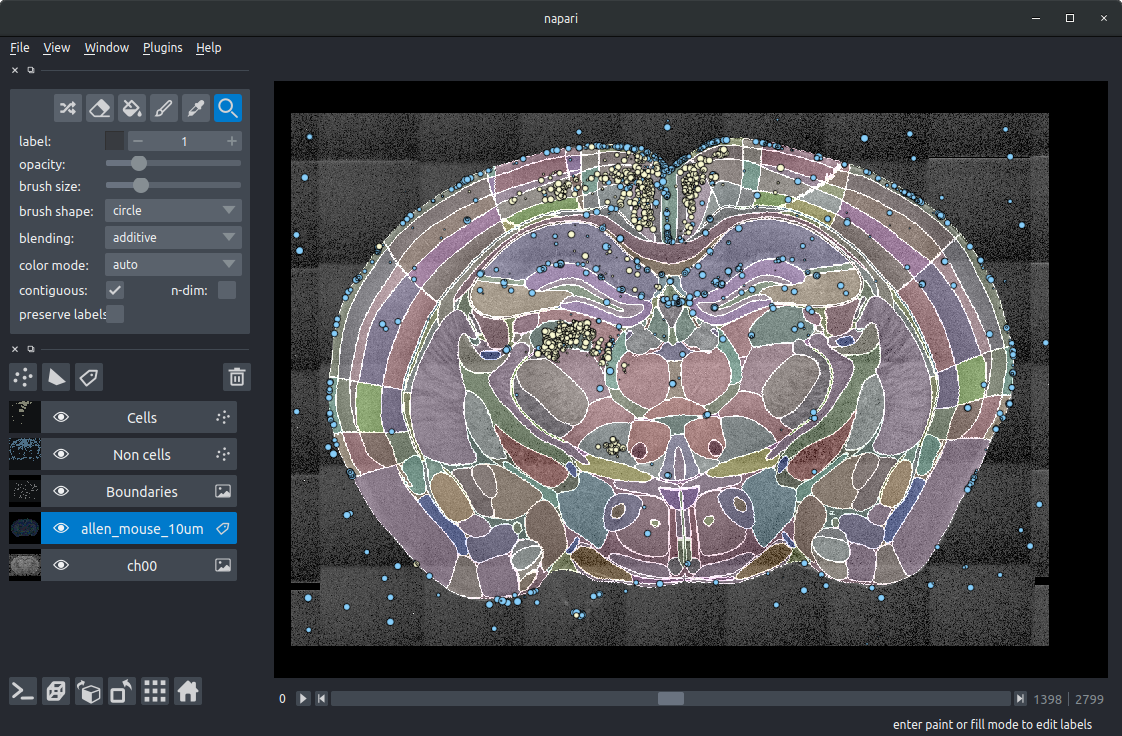
The napari window then will then be populated with different layers (left-hand side) that can be toggled:
ch00The raw image data.allen_mouse_10umThe atlas annotations.BoundariesThe boundaries of the segmented regions.Non cellsThe cell candidates classified as artefacts (blue).CellsThe cell candidates classified as cells (yellow).
If you click on the image above to enlarge, you should get a good idea of how brainmapper works:
The coloured regions and the outlines show the segmentation of the brain (following atlas registration).
The yellow circles show the detected cells (mostly in retrosplenial cortex and thalamus). There are also a few false positives (such as three on the surface of the brain and one outside the brain). This shows that the cell classification network (trained on other brains) is not quite 100%, and should be retrained with the addition of some data from this brain.
The blue circles show those cell candidates classed as artefacts by the cell classification network. The majority of these are outside the brain, on the brain surface, or are blood vessels. A small number are cells, again indicating that the classification network could be retrained.
Hint
To make the results a bit more obvious when zoomed out, the contrast of the raw data (ch00) has been adjusted along with changing the symbol for the cells to disc and increasing the size.
::
These images are useful to assess how well brainmapper performed, but not much use for any kind of numerical analysis.
To see what data is exported from brainmapper, take a look at Exploring the numerical results.