Visualisation#
The cellfinder package that the brainmapper workflow uses comes with a plugin for napari to allow you to easily view results.
Getting started#
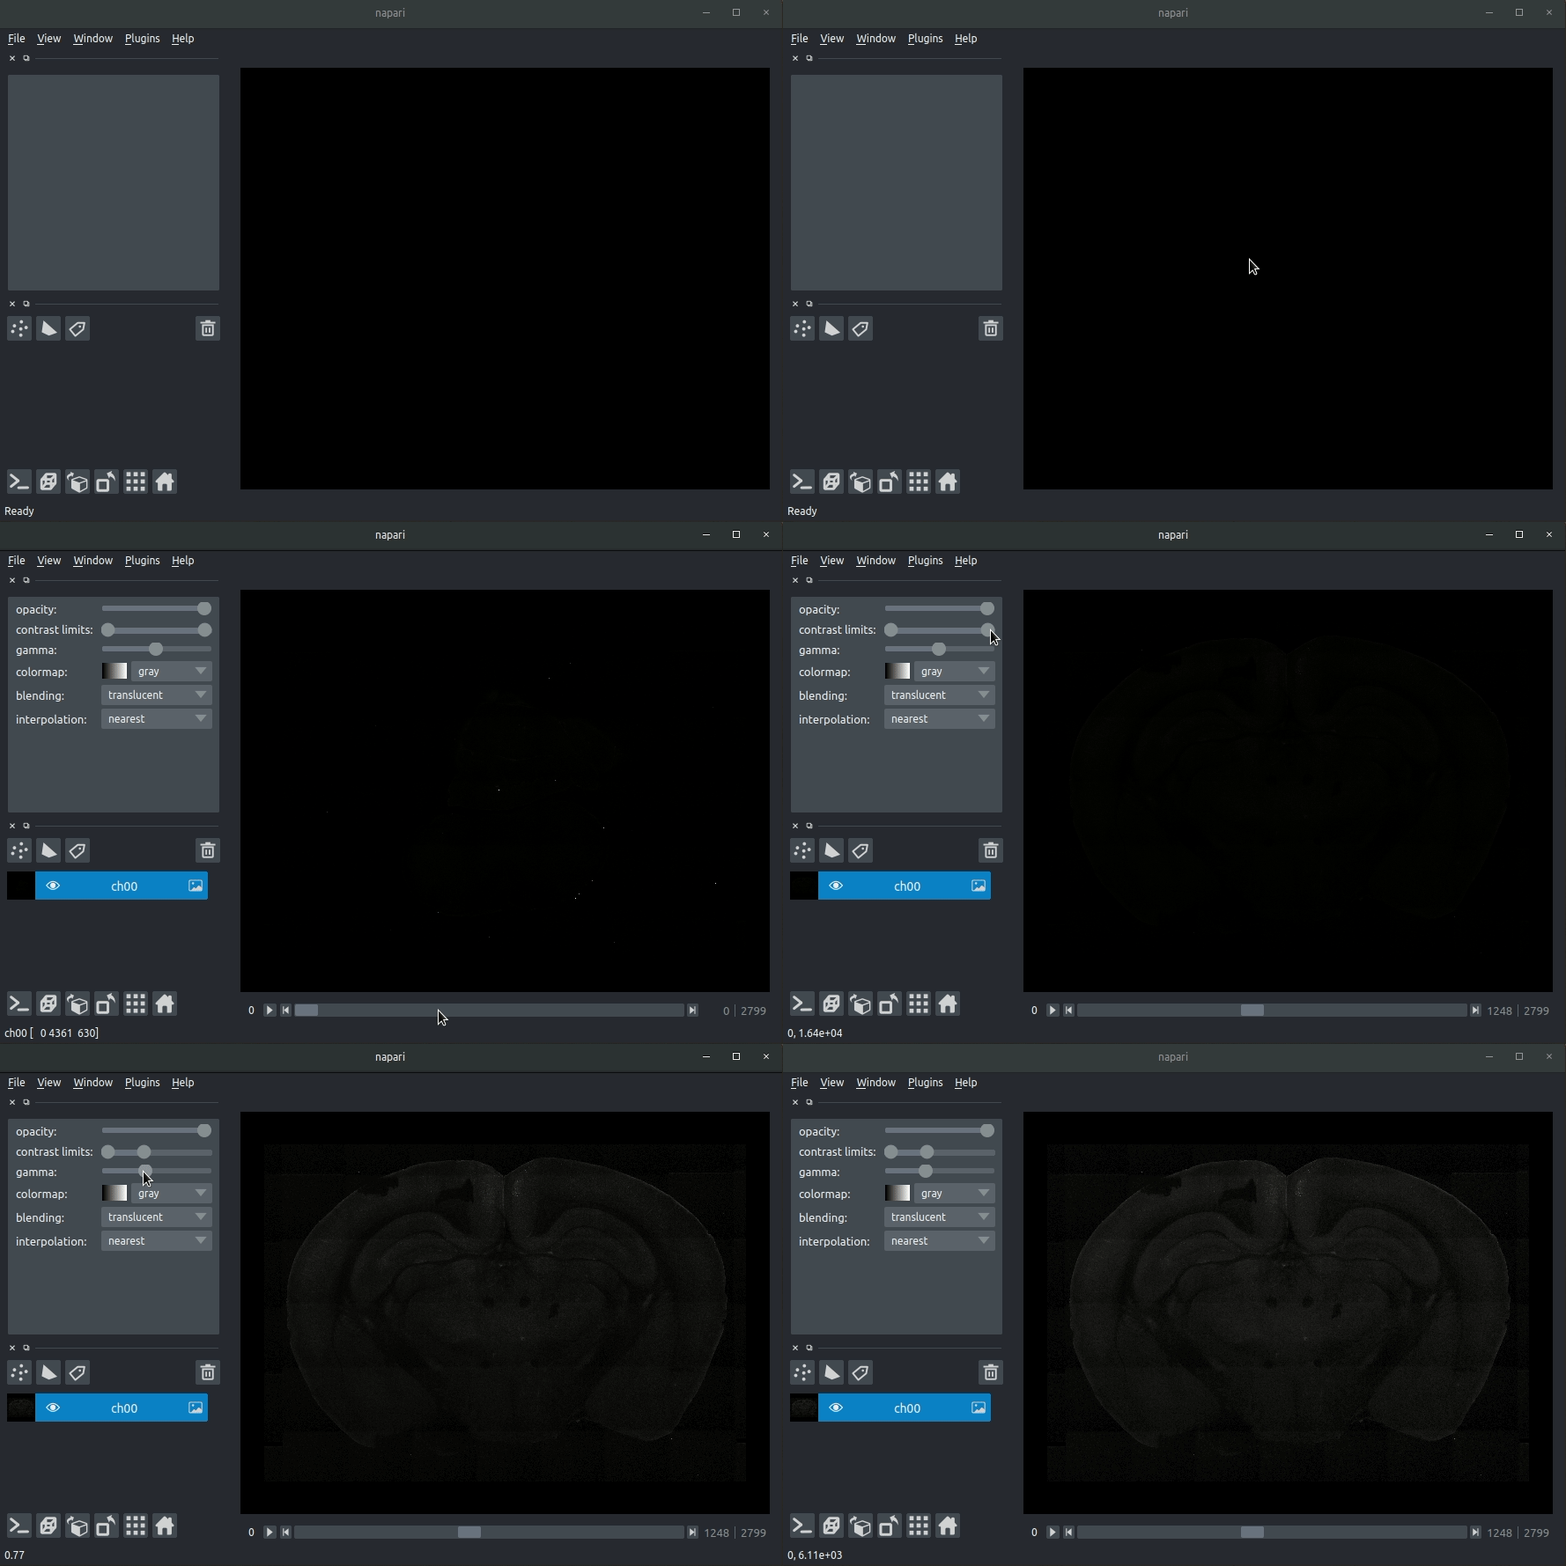
To view your data, firstly, open napari. The easiest way to do this is open a terminal (making sure your brainmapper conda environment is activated), then just type napari.
A napari window should open.
Visualising your raw data#
Assuming that your raw data is stored as .tiff files, drag these into napari (onto the main window in the middle).
This should be whatever you passed to brainmapper originally, i.e., a single multipage tiff, or a directory of 2D tiffs.
You can load as many channels as you like (e.g., the signal and the background channel).

Visualising your results#
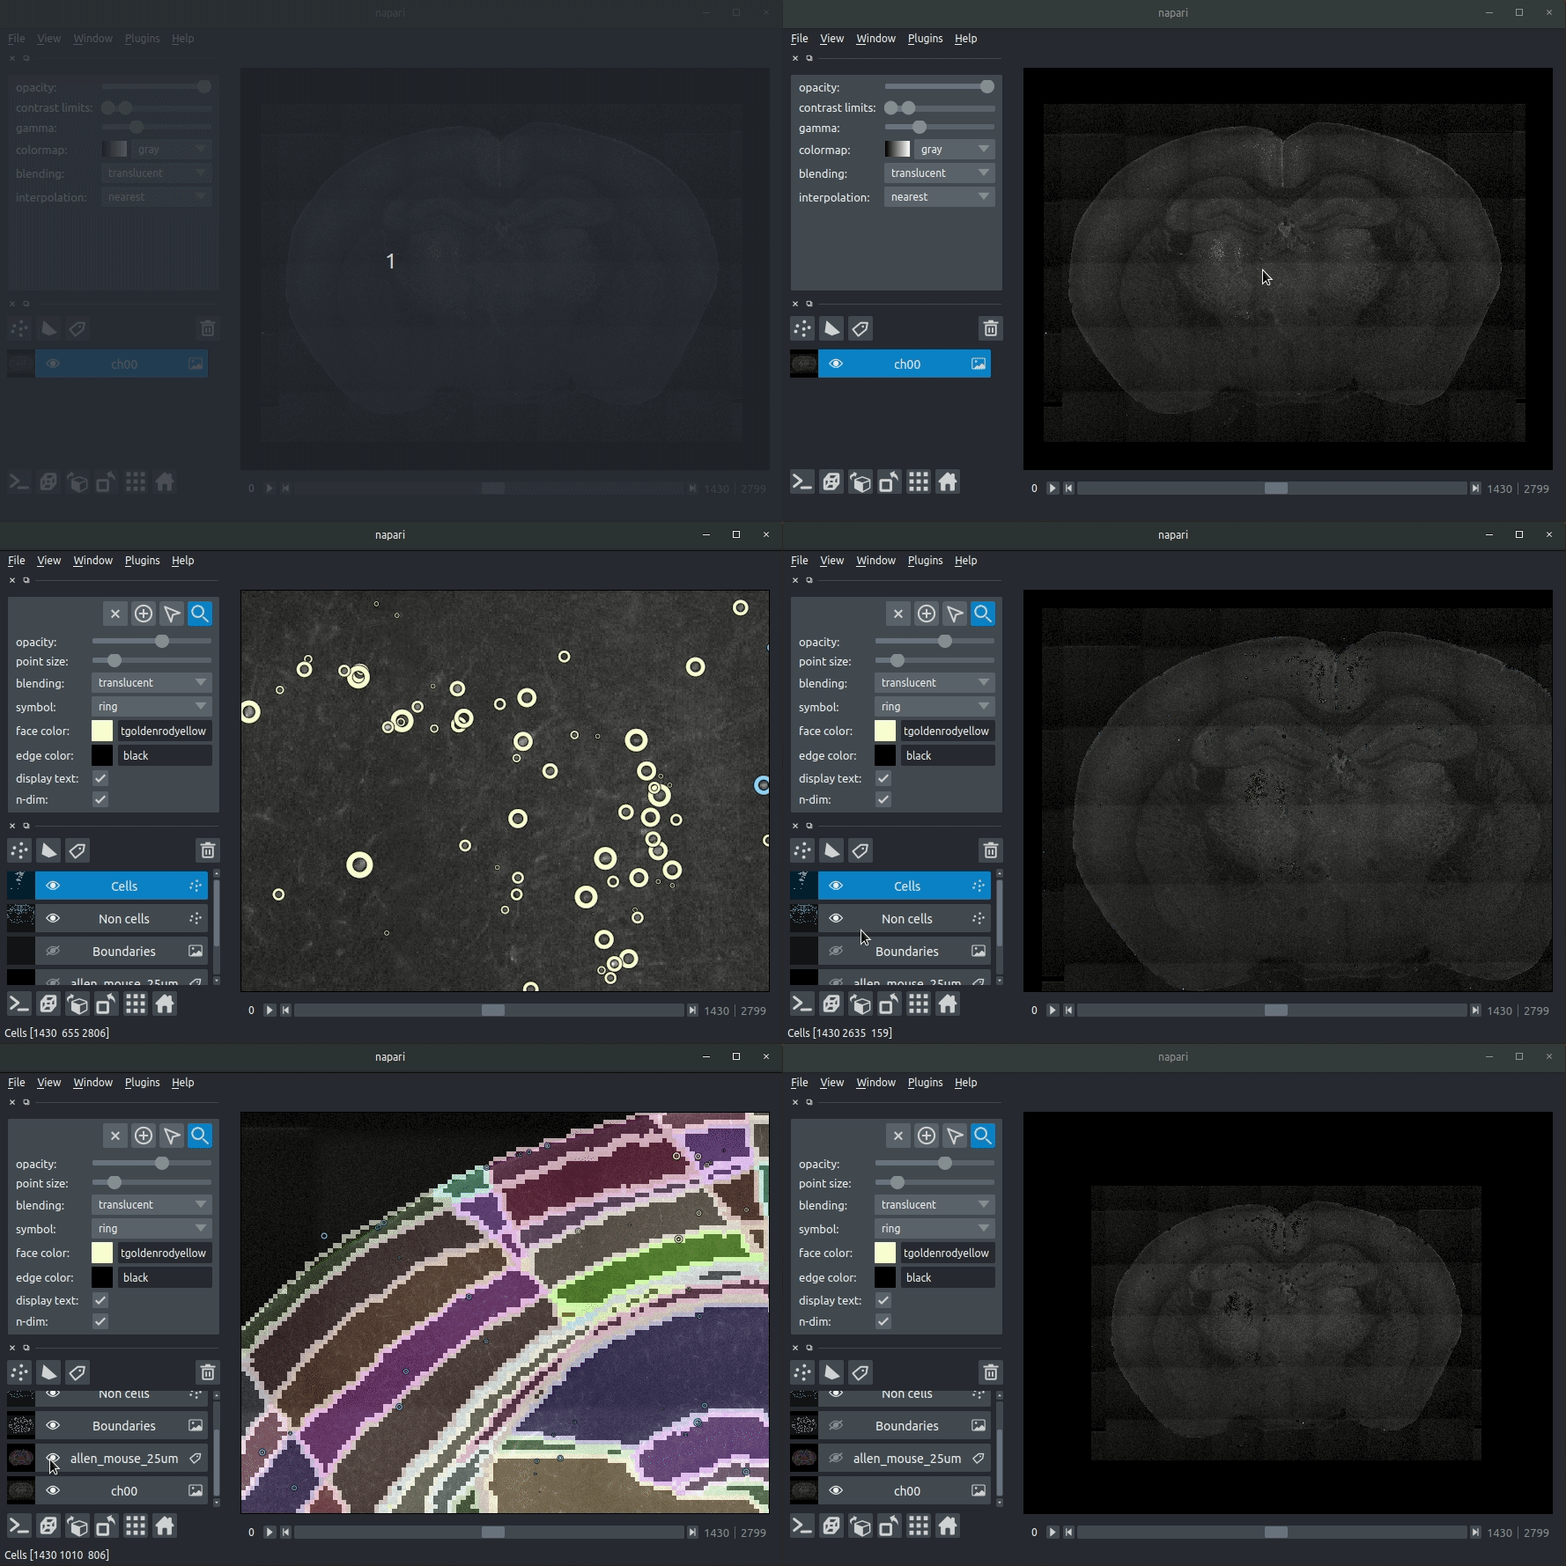
You can then drag and drop the brainmapper output directory (the one you specified with the -o flag) into the napari window.
The plugin will then load your detected cells (in yellow) and the rejected cell candidates (in blue).
If you carried out registration, then these results will be overlaid (similarly to the brainreg plugin, but transformed to the coordinate space of your raw data).

