Visualising your data in brainrender#
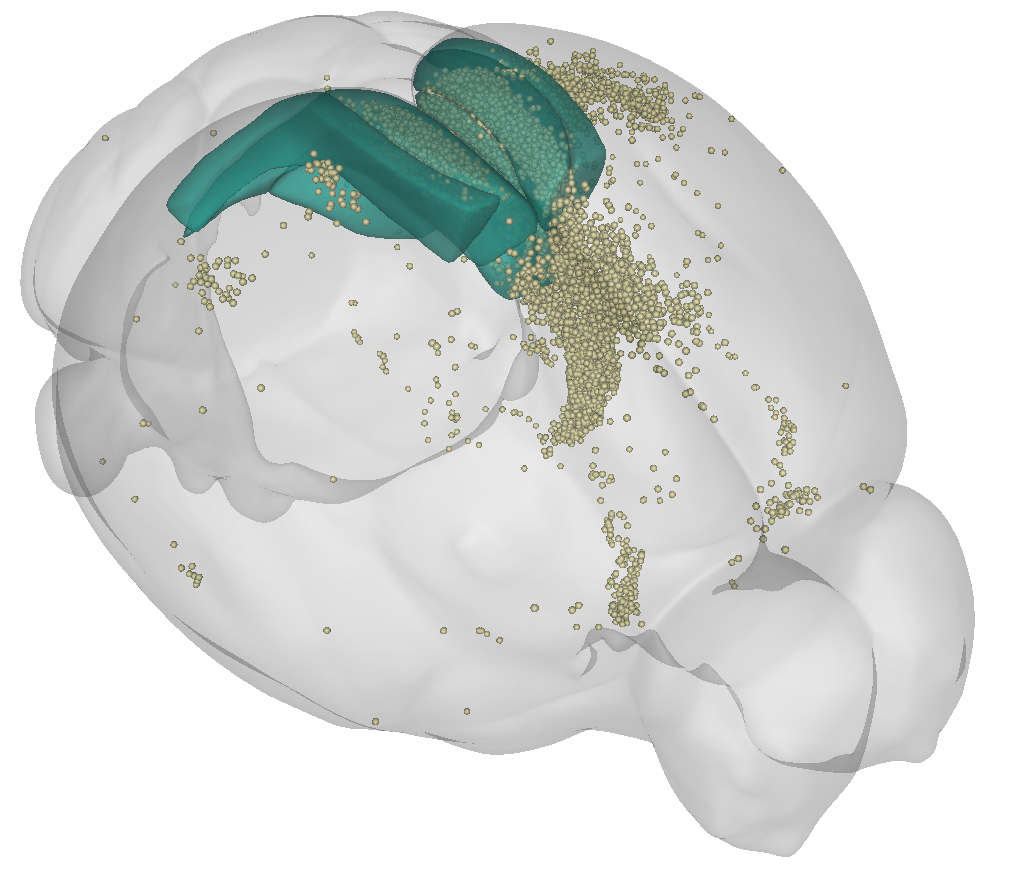
To generate 3D figures of your data in atlas space, you can use brainrender.
brainmapper automatically exports a file in a brainrender compatible format, which can be found at
test_brain/output/points/points.npy.
Once you’ve installed brainrender, you can try something like this:
from brainrender.scene import Scene
from brainrender.actors import Points
from brainrender import settings

settings.SHADER_STYLE = "plastic"
cells_path = "test_brain/output/points/points.npy"

# Initialise brainrender scene
scene = Scene()

# Create points actor
cells = Points(cells_path, radius=45, colors="palegoldenrod", alpha=0.8)

# Visualise injection site (retrosplenial cortex)
scene.add_brain_region("RSPd", color="mediumseagreen", alpha=0.6)
scene.add_brain_region("RSPv", color="purple", alpha=0.6)
scene.add_brain_region("RSPagl", color="mediumseagreen", alpha=0.6)

# Add cells
scene.add(cells)

scene.render()
Hint
As the points.npyfile contains the detected cells in atlas space, you can load cells from
multiple brains (e.g., in a different colour).