Analysing brainwide distribution of cells#
In this tutorial you will use the brainmapper napari widget
to analyse the position of some points in the context of a BrainGlobe atlas.
The aim of this tutorial is to illustrate how to use the widget on a small dataset. After completing this tutorial,
you could try using the widget with the outputs of the
whole brain cell detection tutorial, or even analyse the data from start to finish
using cellfinder, brainreg and then this
brainmapper widget.
Note
You will need napari installed on your machine, and also to have previously run brainreg. Before following the next
steps, please ensure you have followed the
registering a whole-brain image to an atlas tutorial.
Open
napari.Install
brainglobe-utilsby selectingPlugins > Install/Uninstall pluginsand searching forbrainglobe-utilsin the searchbox. Then click on theInstallbutton.Open the
brainmapperwidget by selectingPlugins > brainmapper (BrainGlobe)in the napari menu bar near the top left of the window.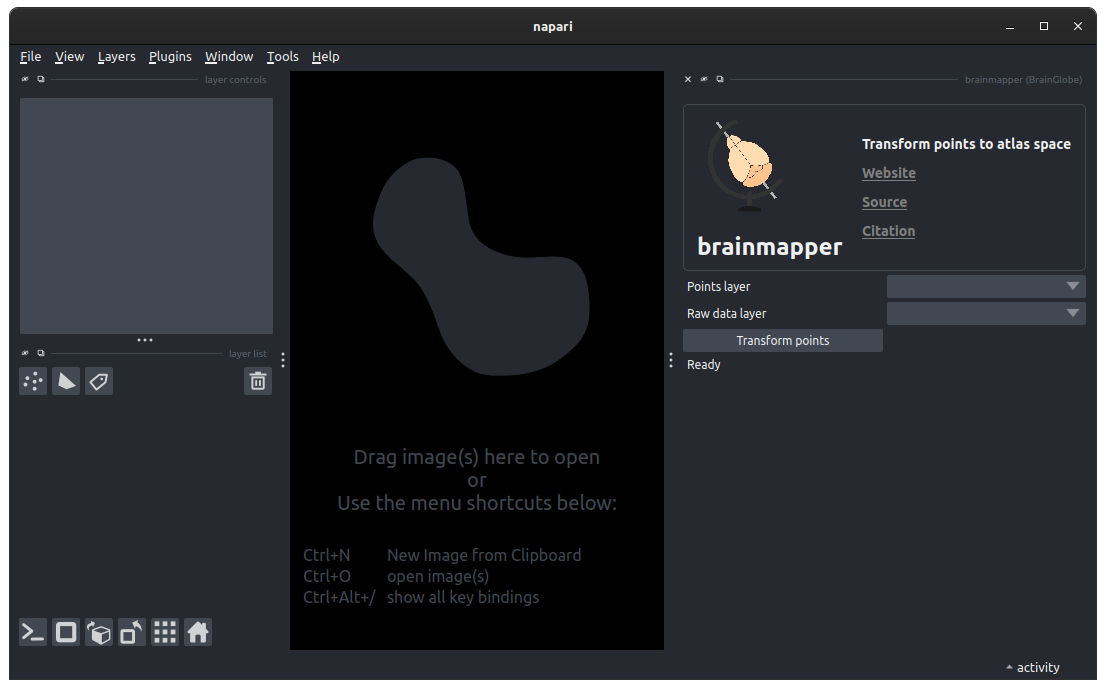
The brainmapper widget appears on the right-hand side of the window.
Open the same sample image from the registering a whole-brain image to an atlas tutorial by selecting
File > Open Sample > Low resolution brain (brainreg).Make the image easier to see by adjusting the
contrast limitsin the top left section of the napari window. Moving the right-hand slider to the left will make the image appear brighter.Create a new points layer by clicking the
New points layerbutton (on the left, just above the list of napari layers).Select the
Add pointsbutton from the top left of the napari window (you can also press2orpon your keyboard to activate this mode).Create a few (10-20) points by clicking on various parts of the brain image. You can navigate in 3D by using the slider at the bottom of the napari window.
Hint
In this tutorial we are creating some points manually. In real usage, these could be any point feature in your image, detected manually or automatically (e.g. with cellfinder).
In the
brainmapperwidget, select your new points layer (namedPointsby default) from the dropdown next toPoints layer.Select your image layer (named
Sample brainby default) from the dropdown next toRaw data layer.Click
Transform pointsand when prompted, select the brainreg output directory saved during the registering a whole-brain image to an atlas tutorial.A new table will then appear in the widget, listing the number of cells in each atlas region, for each hemisphere. Two new points layers will also be created.
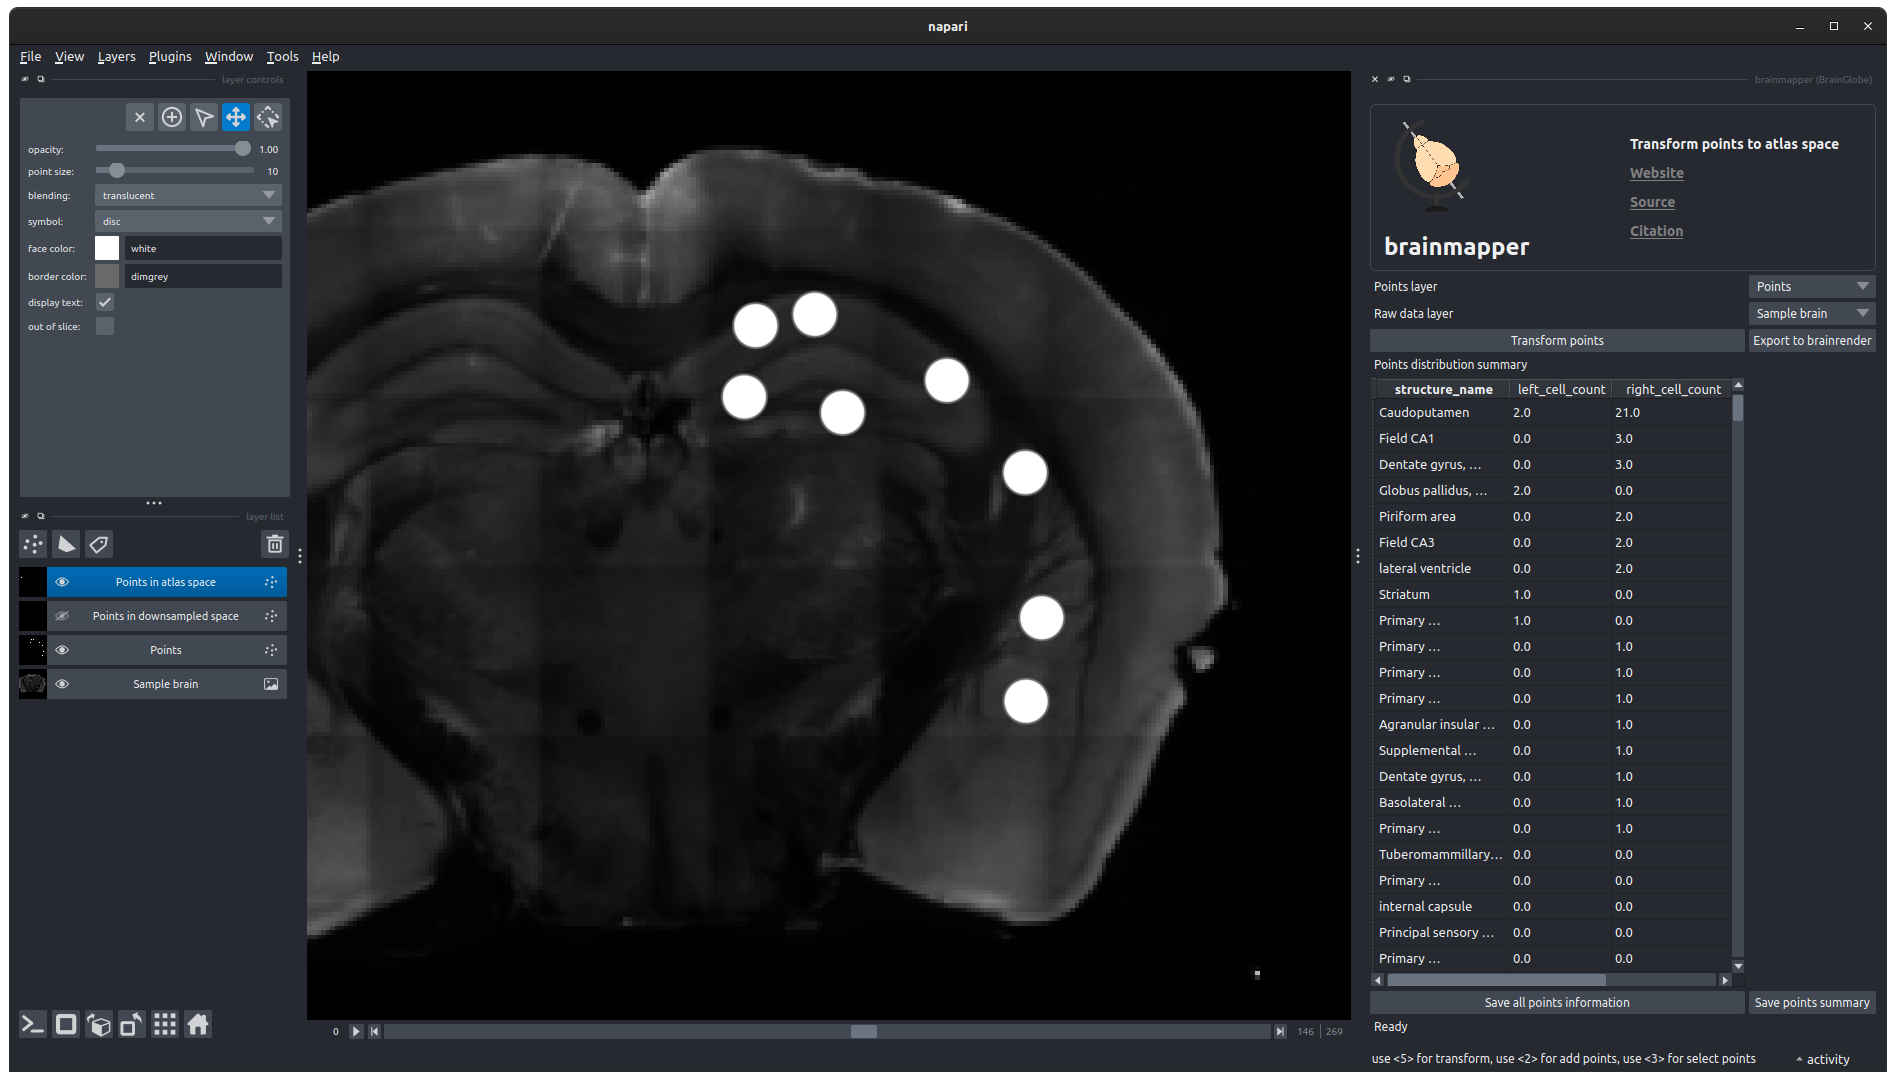
The distribution of points is displayed in the widget, and two new layers are generated.
Click on
Save points summary, choose a directory, and call the filepoints_summary.csv. This will save a file containing a more detailed version of the table.Click on
Save all points information, choose a directory, and call the fileall_points.csv. This will save a file containing the coordinates (in image and atlas space) and atlas region for every point for use in other analyses.Select the
Points in atlas spacelayer. This is the same as thePointslayer, but each point has been moved to its position within the atlas (in voxel space). This can be saved to disk using any compatible plugin.Click on
Export to brainrender, choose a directory, and call the filepoints.npy. This will save a file that can be visualised using brainrender.
Hint
Saving points layers with an .xml file extension will save the points layer to the BrainGlobe format, and these can
be loaded into other BrainGlobe tools.